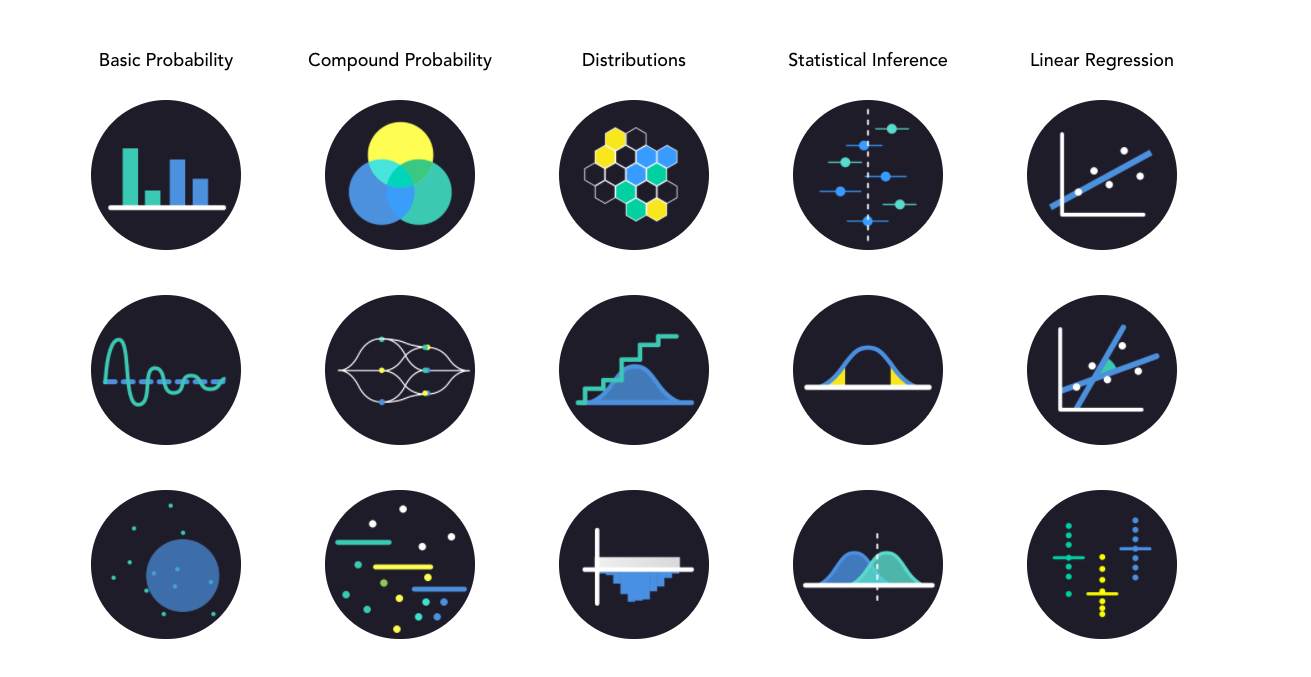
This is just great! Daniel Kunin, a student of Brown university has created a visual introduction to statistics! As we learned in our university stats course understanding (basic) statistics and especially the term „statistical significance“ is becoming more and more important (yes, even when you’re a designer!)
„The goal of the project is to make statistics more accessible to a wider range of students through interactive visualizations.“
Oh would I only have known this last year when I was fighting with probability theory, combinatorics, ANOVA, confidence intervals, cohen’s d & co in the stats course.
Visit and learn: http://students.brown.edu/seeing-theory/index.html